| [1] |
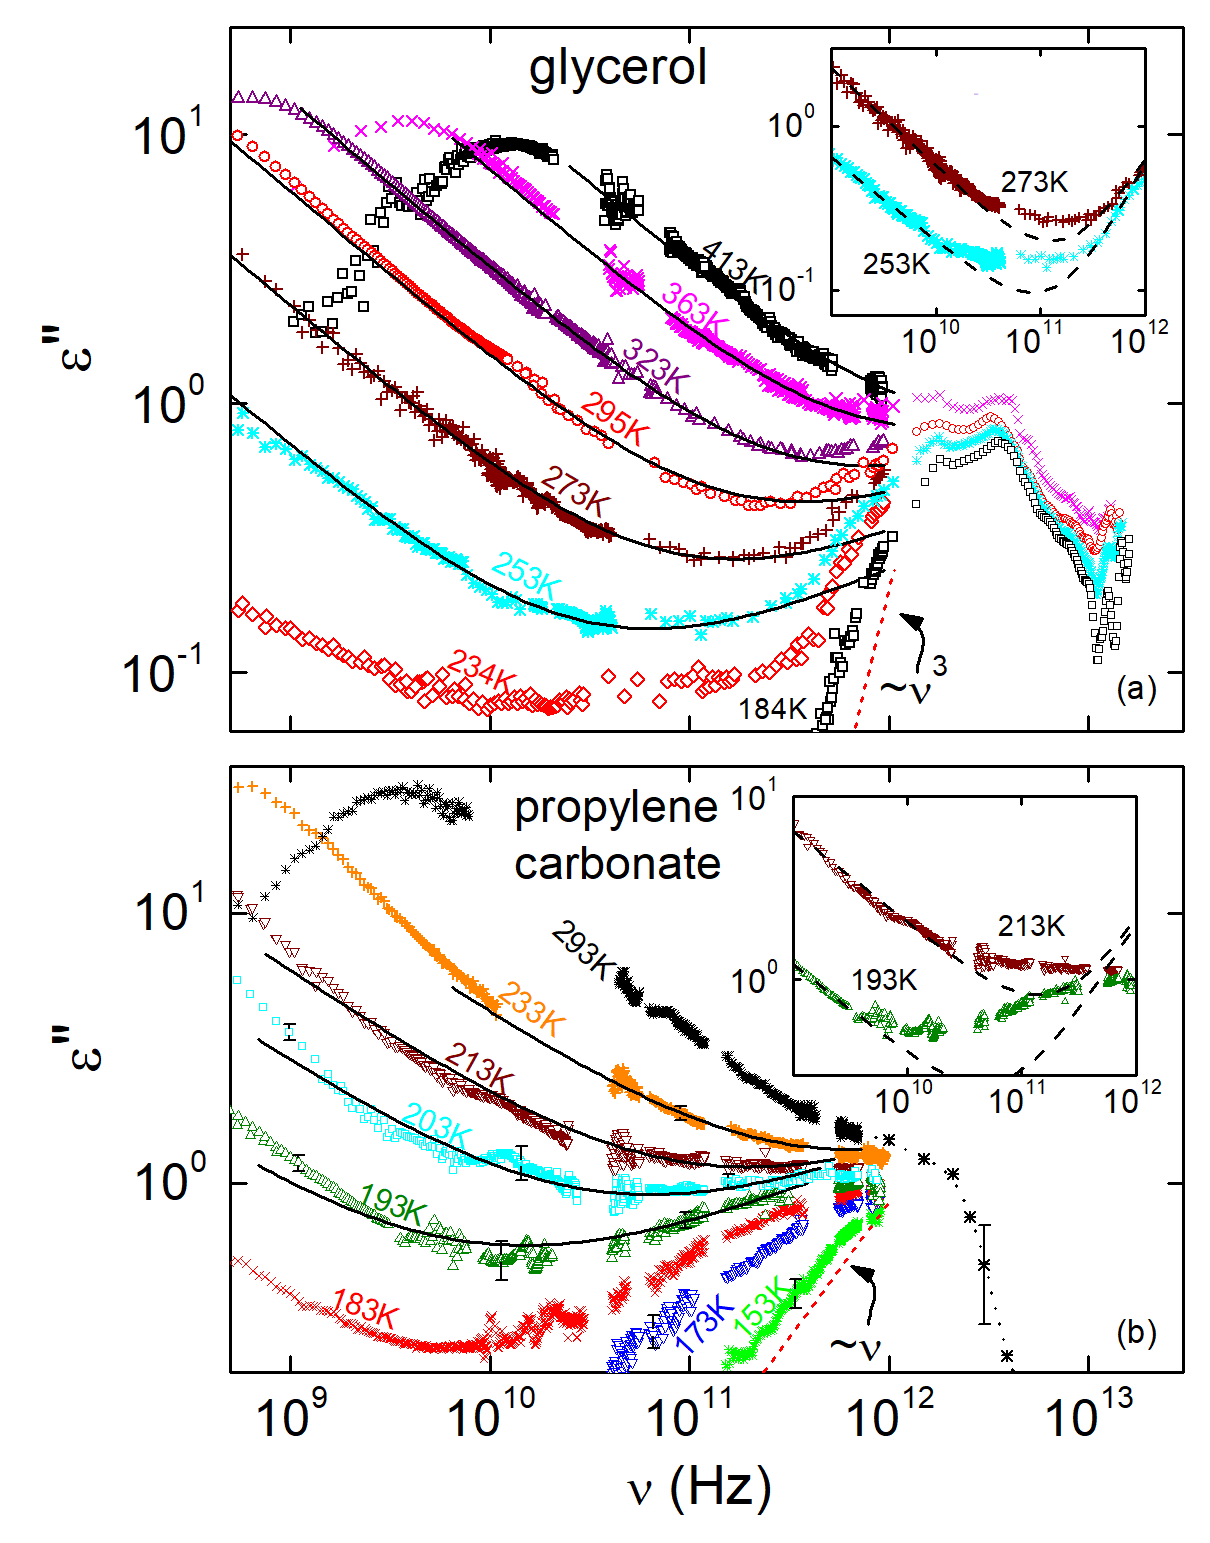
Fast dynamics of glass-forming glycerol studied by dielectric spectroscopy
P. Lunkenheimer, A. Pimenov, M. Dressel, Yu. G. Goncharov, R. Böhmer, and A. Loidl,
Phys. Rev. Lett. 77, 318 (1996).
[PDF]
|
| [2] |
Fast dynamics in CKN and CRN investigated by dielectric spectroscopy
P. Lunkenheimer, A. Pimenov, and A. Loidl,
Phys. Rev. Lett. 78, 2995 (1997).
[PDF]
|
| [3] |
Relaxations and fast dynamics of the plastic crystal cyclo-octanol investigated by broadband dielectric
spectroscopy
R. Brand, P. Lunkenheimer, and A. Loidl,
Phys. Rev. B 56, R5713 (1997).
[PDF]
|
| [4] |
Dielectric and far-infrared spectroscopy of glycerol
U. Schneider, P. Lunkenheimer, R. Brand, and A. Loidl,
J. Non-Cryst. Solids 235-237, 173 (1998). |
| [5] |
Broadband dielectric spectroscopy on glass-forming propylene carbonate
U. Schneider, P. Lunkenheimer, R. Brand, and A. Loidl,
Phys. Rev. E 59, 6924 (1999).
[PDF]
|
| [6] |
Glassy dynamics
P. Lunkenheimer, U. Schneider, R. Brand, and A. Loidl,
Contemp. Phys. 41, 15 (2000). |
| [7] |
Propylene carbonate reexamined: Mode-coupling β scaling without factorisation?
J. Wuttke, M. Ohl, M. Goldammer, S. Roth, U. Schneider, P. Lunkenheimer, R. Kahn, B. Ruffle, R. Lechner, and M.A. Berg,
Phys. Rev. B 61, 730 (2000).
[PDF]
|
| [8] |
Glassy dynamics beyond the α-relaxation
P. Lunkenheimer and A. Loidl,
in: Broadband Dielectric Spectroscopy,
eds. F. Kremer and A. Schönhals (Springer, Berlin, 2003), p. 131. |
| [9] |
Glassy dynamics in mono-, di-, and tri-propylene glycol: From the α- to the fast β
relaxation
M. Köhler, P. Lunkenheimer, Y. Goncharov, R. Wehn, and A. Loidl,
J. Non-Cryst. Solids 356, 529 (2010).
|
| [10] |
High-frequency dynamics of type B glass formers investigated by broadband dielectric spectroscopy
S. Kastner, M. Köhler, Y. Goncharov, P. Lunkenheimer, and A. Loidl,
J. Non-Cryst. Solids 357, 510 (2011). |
| [11] |
Dielectric spectroscopy of glassy dynamics
P. Lunkenheimer, M. Köhler, S. Kastner, and A. Loidl,
in:
Structural Glasses and Supercooled Liquids: Theory, Experiment, and Applications,
eds. P.G. Wolynes and V. Lubchenko (Wiley, Hoboken, 2012), p. 115. |
| [12] |
Ions in glass-forming glycerol: Close correlation of primary and fast β relaxation
M. Köhler, P. Lunkenheimer, Y. Goncharov, and A. Loidl,
Phys. Rev. E 87, 062320 (2013).
[PDF]
|
| [13] |
Fast dynamics in glass-forming salol investigated by dielectric spectroscopy
P. Lunkenheimer, R. Wehn, M. Köhler, and A. Loidl,
J. Non-Cryst. Solids 492, 63 (2018).
|
| [14] |
Glassy dynamics: From millihertz to terahertz
P. Lunkenheimer and A. Loidl,
in:
The scaling of relaxation processes, eds. F. Kremer and A. Loidl (Springer, Cham, 2018), p. 23.
|