ALPHA RELAXATION
1. Introduction
The α relaxation leads to a
prominent peak in the dielectric-loss spectra of
dipolar glass formers.
It arises from the structural dynamics of the glass-forming particles
(molecules, ions,...) whose continuous slowing down over many decades
upon cooling leads to the glass transition. The α relaxation
reveals two hallmark features of glassy dynamics namely non-exponentiality
and non-Arrhenius behaviour. Both are investigated in our group. The
latter denotes the non-canonical temperature dependence of the α-relaxation
time, which characterises the typical dynamics of the particles constituting the glass. It can be easily
determined from the measured loss spectra.
|
Schematic view of the temperature dependence of relaxation processes of supercooled liquids
as revealed in dielectric-loss spectra. Shown are three typical spectra: (a) At high temperatures, in the
low-viscosity liquid. (b) In the supercooled-liquid regime, below the melting point Tm,
but still well above the glass-transition temperature Tg. (c) Close to Tg,
where the material becomes solid. Upon cooling,
the α-relaxation peak shifts over many decades to lower frequencies, which is typical
for a glass-forming material. With decreasing temperature, the signatures of various additional
dynamic processes appear in the spectra.
[from: P. Lunkenheimer and A. Loidl, Glassy dynamics: From millihertz to terahertz, in
The scaling of relaxation processes,
edited by F. Kremer and A. Loidl (Springer, Cham, 2018), p. 23.]
|
2. Examples
a) α-Relaxation time
Numerous formulae, based on various empirical or theoretical
considerations, have been proposed to describe the temperature
dependence of the α-relaxation
time. Due to the broad frequency range accessible by our
dielectric experiments,
it can be determined from the highest temperatures, deep in the
low-viscosity liquid regime, down to the structural arrest occurring at
the glass temperature or even below [1-5]. Various examples have been
collected in the following publication:
Temperature development of glassy α-relaxation dynamics determined by
broadband dielectric spectroscopy
P. Lunkenheimer, S. Kastner, M. Köhler, and A. Loidl
Phys. Rev. E 81, 051504 (2010). |
Those relaxation-time data cover a range of up to 16 decades (see
examples below), enabling a critical test of the validity of model
predictions.
For this purpose, the data are available for electronic download in the Supplemental Material of that paper.
 |
 |
Temperature-dependent α-relaxation times of four glass formers determined by
broadband dielectric spectroscopy.
The closed symbols denote results deduced from
aging experiments.
The lines are fits with the Vogel-Fulcher-Tammann formula.
[from: P. Lunkenheimer, S. Kastner, M. Köhler, and A. Loidl, Temperature development of
glassy α-relaxation dynamics determined by broadband dielectric spectroscopy,
Phys. Rev. E 81, 051504 (2010).]
|
The above Arrhenius plots show the logarithm of the relaxation time versus the inverse temperature [5]. In this representation,
the naively expected thermally-activated particle dynamics should lead to linear behaviour. However, most glass formers
significantly deviate from this so-called Arrhenius behaviour and instead show a curvature in the Arrhenius plots as seen above.
Since about 100 years, this non-Arrhenius temperature dependence is commonly fitted by the empirical Vogel-Fulcher-Tammann (VFT)
formula, which later on also found some theoretical explanations within various (unfortunately competing) theories.
During these 100 years, dozens of alternatives to the VFT law were proposed, but, until now, none of them is as well-established as VFT.
We used our broadband spectra to test two of these alternatives as published here:
Temperature development of glassy α-relaxation dynamics determined by broadband dielectric spectroscopy
P. Lunkenheimer, S. Kastner, M. Köhler, and A. Loidl
Phys. Rev. E 81, 051504 (2010).
|
Universal correlations between the fragility and interparticle repulsion of glass-forming liquids
P. Lunkenheimer, F. Humann, A. Loidl, and K. Samwer
J. Chem. Phys. 153, 124507 (2020).
|
b) Cooperativity
The typical non-Arrhenius behaviour of glassy dynamics is often ascribed to increasingly correlated motions of the
glass-forming particles when approaching the glass transition upon cooling. The material is assumed to consist of regions,
in which the particles move in a "cooperative" way and whose sizes increase when approaching the transition (see figure below), which should
lead to an increase in the effective energy barriers. As discussed in the
Nonlinear-Spectroscopy
section, one way to check for cooperative motions is the investigation of the higher-order
harmonic components of the dielectric susceptibility [7,9].
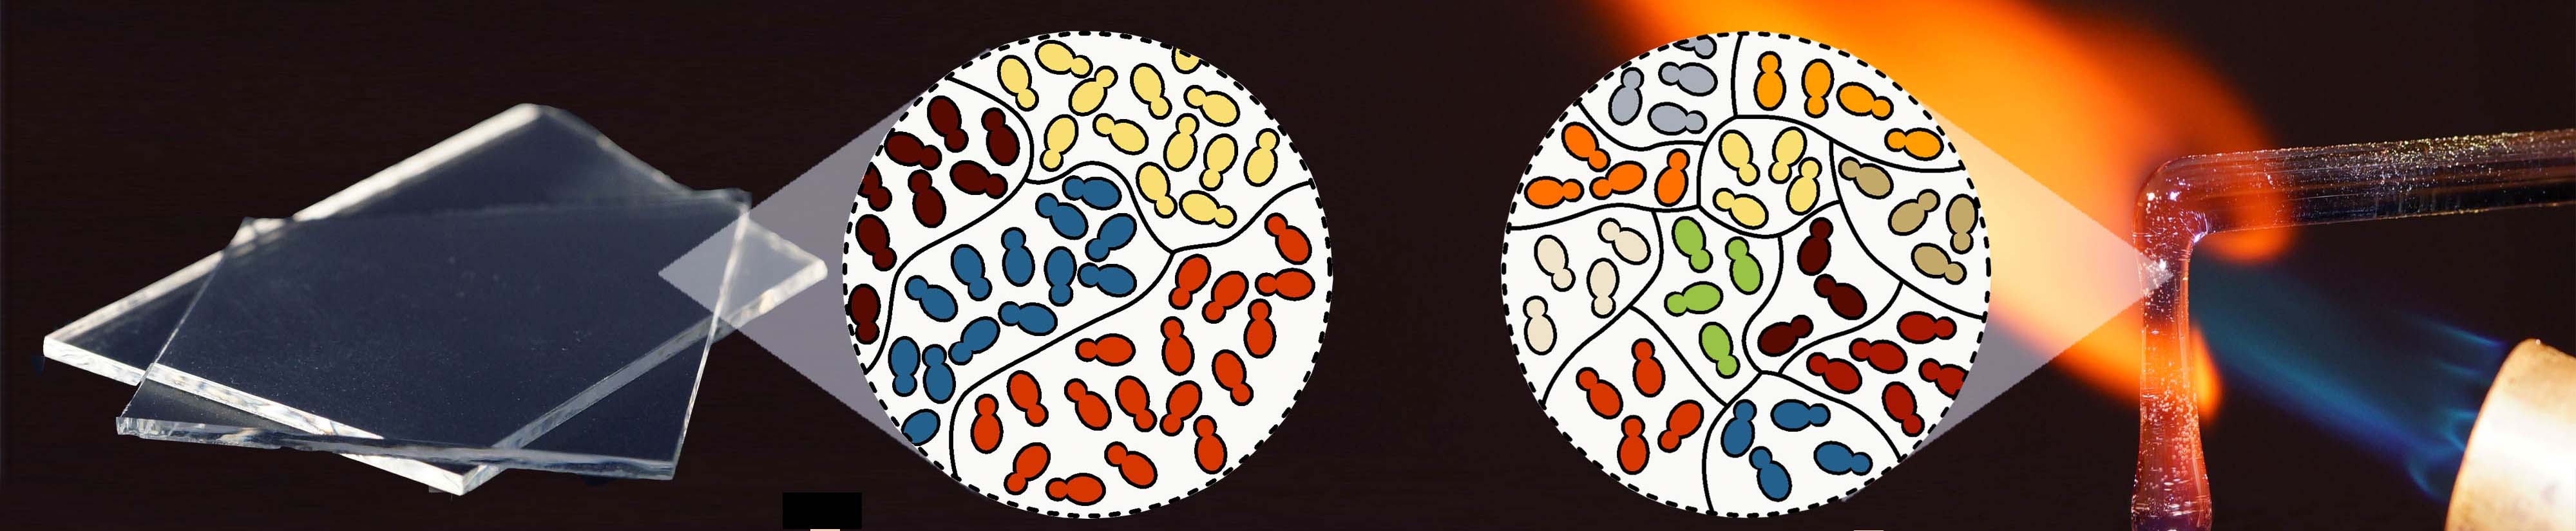
Schematic figure, indicating the growth of cooperativity at the transition from the liquid (right) to the glass (left).
Regions of cooperatively rearranging molecules are indicated by molecules of same color.
The relevance of cooperativity for the glass transition can also be investigated by measuring the particle dynamics
of supercooled liquids that are confined in spaces of nanometer size, e.g., the pores of certain porous materials.
As the size of the cooperatively rearranging regions is supposed to increase with decreasing temperature,
below a certain temperature this size will exceed the pore diameter
and the temperature dependence of the relaxation time changes. From such measurements, using, e.g., metal-organic
frameworks (MOFs) as host materials [8,10], conclusions on the temperature dependence
of the cooperativity length can be drawn as shown for glycerol in the figure below.
 |
Temperature dependence of the cooperativity length Lcorr of glycerol as deduced from
confinement and
nonlinear measurements.
The closed symbols show the results from confinement measurements performed using ZIF- and MFU-type MOFs
as porous host materials [8,10].
The shaded areas indicate the excluded ranges for Lcorr inferred from the obtained limiting values.
The plusses show the temperature-dependent correlation length from measurements of the 3rd harmonic susceptiblity [7],
scaled to the value of 1.46 nm at 213 K that was obtained from the results on glycerol in ZIF-11 [10].
The dashed line indicates a fit of Lcorr(T) from the nonlinear measurements (plusses) with a critical law.
The dash-dotted line indicates a possible temperature-independent Lcorr above TA ~ 288K.
The arrows indicate the Vogel-Fulcher temperature, glass temperature and TA.
[from: M. Uhl, J.K.H. Fischer, P. Sippel, H. Bunzen, P. Lunkenheimer, D. Volkmer, and A. Loidl,
Glycerol confined in zeolitic imidazolate frameworks: The temperature-dependent cooperativity length scale of glassy freezing,
J. Chem. Phys. 150, 024504 (2019).]
|
3. Some relevant publications from our group:
| [1] |
Dielectric and far-infrared spectroscopy of glycerol
U. Schneider, P. Lunkenheimer, R. Brand, and A. Loidl,
J. Non-Cryst. Solids 235-237, 173 (1998). |
| [2] |
Broadband dielectric spectroscopy on glass-forming propylene carbonate
U. Schneider, P. Lunkenheimer, R. Brand, and A. Loidl,
Phys. Rev. E 59, 6924 (1999).
[PDF]
|
| [3] |
Glassy dynamics
P. Lunkenheimer, U. Schneider, R. Brand, and A. Loidl,
Contemp. Phys. 41, 15 (2000). |
| [4] |
Dielectric spectroscopy of glass-forming materials: α-relaxation and
excess wing
P. Lunkenheimer and A. Loidl,
Chem. Phys. 284, 205 (2002). |
| [5] |
Temperature development of glassy α-relaxation dynamics determined by
broadband dielectric spectroscopy
P. Lunkenheimer, S. Kastner, M. Köhler, and A. Loidl,
Phys. Rev. E 81, 051504 (2010).
[PDF]
|
| [6] |
Glassy dynamics under superhigh pressure
A.A. Pronin, M.V. Kondrin, A.G. Lyapin, V.V. Brazhkin, A.A. Volkov, P. Lunkenheimer, and A. Loidl,
Phys. Rev. E 81, 041503 (2010).
[PDF]
|
| [7] |
Cooperativity and the freezing of molecular motion at the glass transition
Th. Bauer, P. Lunkenheimer, and A. Loidl,
Phys. Rev. Lett. 111, 225702 (2013).
[PDF]
|
| [8] |
Metal-organic frameworks as host materials of confined supercooled liquids
J.K.H. Fischer, P. Sippel, D. Denysenko, P. Lunkenheimer, D. Volkmer, and A. Loidl,
J. Chem. Phys. 143, 154505 (2015).
[PDF]
|
| [9] |
Fifth-order susceptibility unveils growth of thermodynamic amorphous order in glass-formers
S. Albert, Th. Bauer, M. Michl, G. Biroli, J.-P. Bouchaud, A. Loidl,
P. Lunkenheimer, R. Tourbot, C. Wiertel-Gasquet, and F. Ladieu,
Science 352, 1308 (2016).
|
| [10] |
Glycerol confined in zeolitic imidazolate frameworks: The temperature-dependent cooperativity
length scale of glassy freezing
M. Uhl, J.K.H. Fischer, P. Sippel, H. Bunzen, P. Lunkenheimer, D. Volkmer, and A. Loidl,
J. Chem. Phys. 150, 024504 (2019).
[PDF]
|
| [11] |
Universal correlations between the fragility and interparticle repulsion of glass-forming liquids
P. Lunkenheimer, F. Humann, A. Loidl, and K. Samwer,
J. Chem. Phys. 153, 124507 (2020).
[PDF]
|
Homepage P. Lunkenheimer